Behold the Sigmoid: The Importance of the S Curve in High Tech Product Adoption
3/20/1995
“Behold this mighty nation, its rules and its wise men listening to -- Malthus! It is mournful, mournful...”
—Samuel Taylor Coleridge
Who is Malthus? And why did Coleridge consider it such a grievous mistake to listen to him?
And but who is Coleridge I wonder? Oh okay, English poet, founder of the Romantic Movement—thx Wikipedia.
Thomas Robert Malthus, a part-time clergyman and professional predictor, is best known for his late seventeenth century work titled An Essay on the Principle of Population as It Affects the Future Improvement of Society, with Remarks on the Speculations of M. Goodwin, M. Condorcet, and Other Writers. And while title terseness was clearly not one of Malthus's better traits, innovative, nonlinear thinking was.
In An Essay, Malthus argued that the world was doomed to overpopulation because the number of humans on the planet was growing at a geometric, nonlinear rate, whereas the food supply was limited to an arithmetic, linear progression. As a result, Malthus urged the leaders of his time to denounce fertility and to embrace moral restraint. Fortunately for us, Malthus was wrong.
However, we come here to praise Malthus, not to ridicule him. After all, he is the father of nonlinear thinking. And it was not the use of nonlinear thinking that failed Malthus, but rather the lack of use of his own, self-discovered tool. You see, the food supply expanded at an exponential rate as well, owing to the advances in farming productivity.
By now, you may be wondering what, if anything, this has to do with investing in high tech stocks. Well, it is our belief that high tech investors are frequently misled by the folly of linear interpolation. Therefore, if we could identify an event which we knew to be nonlinear, we could leverage Malthus's brilliance and hopefully outwit the market.
This intro is great. I enjoy his choice to start with something that lands far afield of his subject—Malthusian Theory—and using it as a jumping off point for the rest of the piece. Kept me very engaged in finding the answer to the puzzle: where’s the lesson for investors?
The Sigmoid Curve
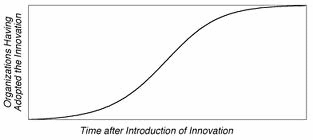
It just so happens that we have a particular nonlinear event in mind. It is a generally accepted principal that new products diffuse along an S-shaped curve, also known as a Sigmoid. The seminal work that first sought to quantify the dynamics of new product diffusion was Frank M. Bass's 1969 paper, A New Product Growth Model for Consumer Durables. Bass argued that potential adopters were influenced by either mass media or word of mouth. Therefore, in order to account for word of mouth influence, Bass developed an equation that was a function of the penetration of the potential installed base. Inclusion of this variable resulted in a nonlinear equation.
Here is the diagram:
High technology products are even more prone to diffuse in a nonlinear pattern. This is because, as the usage of a product grows, so does the infrastructure that allows for more uses and more users. Think about the how the VCR proliferated. As the number of available videos and video stores grew, the likelihood of adoption for each individual user grew exponentially.
Gurley’s describing a network effect here—as your friends all start Venmo accounts, it becomes a (compoundingly) more attractive service as you can now easily pay them.
Now, as we said before, we think most investors wear "linear-blinders," and we think this represents opportunity. Take a look at the chart in the middle of the next page (for those readers with an electronic copy, draw an elongated S-curve on a sheet of paper and connect the endpoints with a straight line). The dark curved line represents the typical Sigmoid, or diffusion curve that most new products follow.
We think most linear investors expect a new product to diffuse along the straight line that connects the two endpoints (line 1). There is a known installed base, and sales will gradually approach that level. Mr. LI (Linear Investor) plugs his unit expectations into his earnings model, and is quite pleased with what he sees. He is a buyer of the stock.
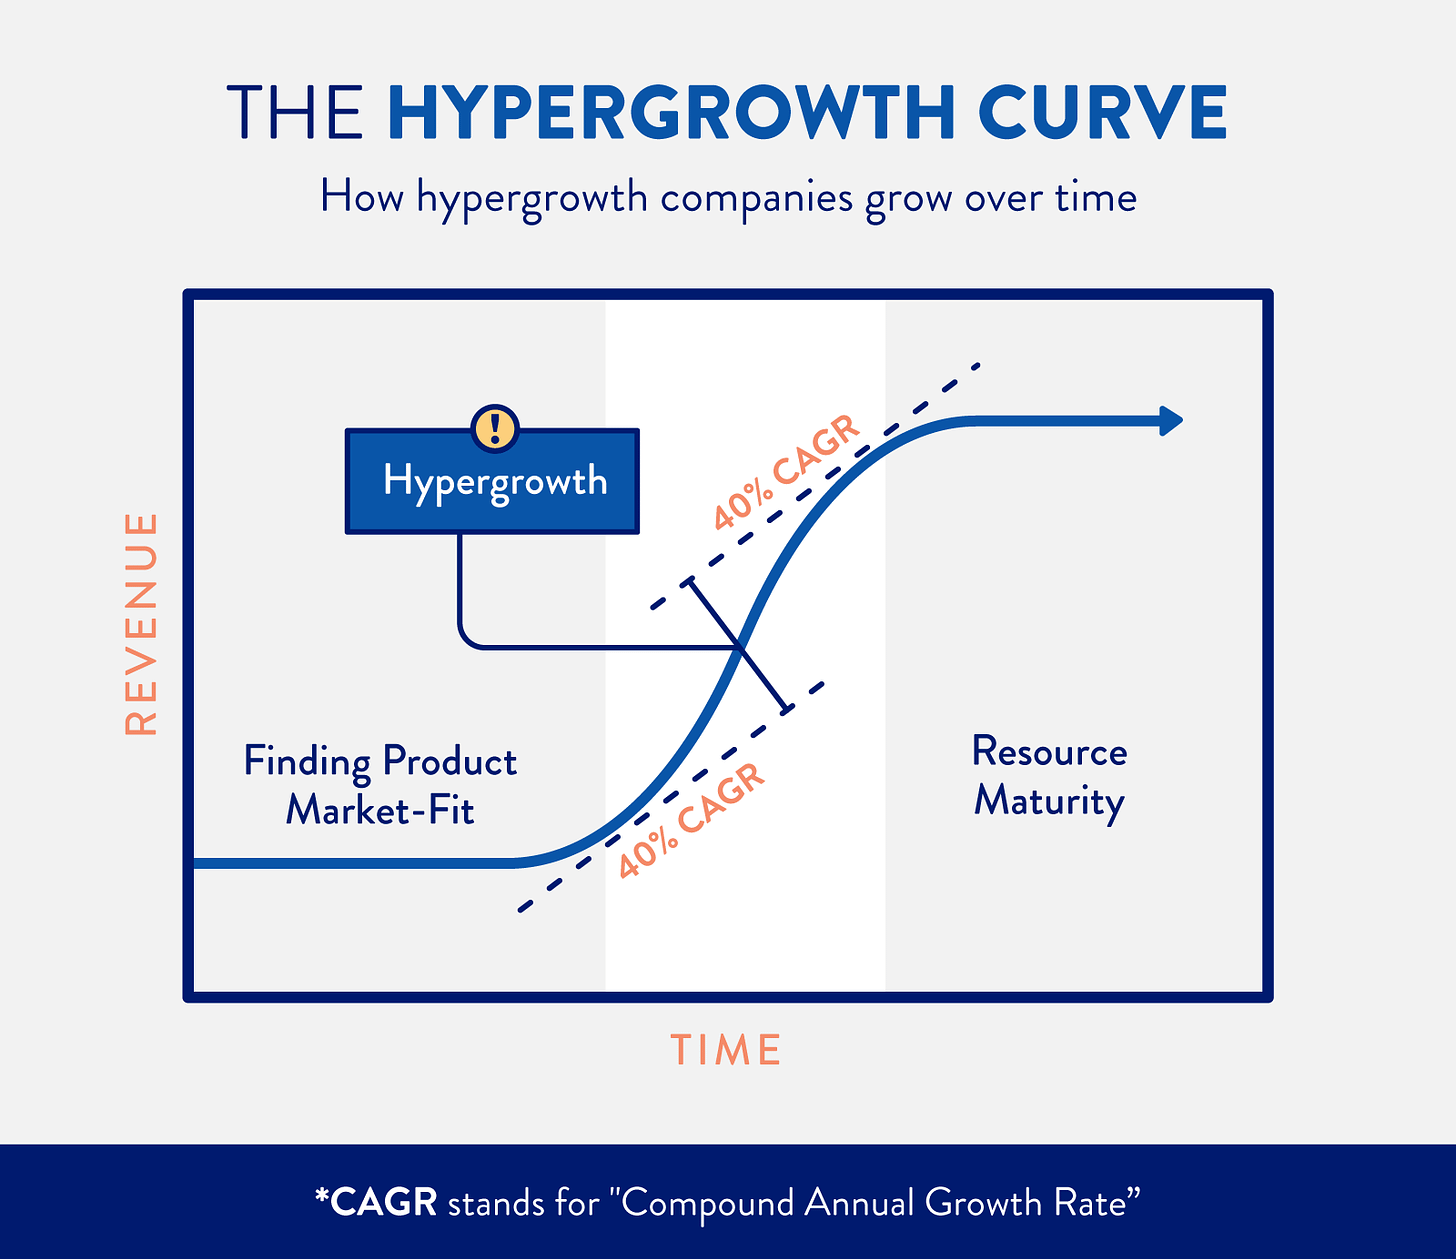
This is an assessment that was clearly right—investors had not thought carefully about the implications of exponential growth. It’s why hypergrowth was such a Valley-consuming, popular concept when Alexander Izosimov first introduced it in 2008.
Here’s how Izosimov describes hypergrowth: “The steep part of the S-curve that most young markets and industries experience at some point, where the winners get sorted from the losers.”
As real sales begin to emerge along the curve and not the line, Mr. LI becomes disconcerted. To compensate, he "redraws" his linear expectation along the bottom of the S-curve (line 2), assuming that the error must have been either in his acceptance rate or his assumptions for the size of the potential market. Now disappointed, Mr. LI dumps his shares at a loss.
Low and behold, just a few short months after Mr. LI bailed out, the new product takes off and so does the stock. Mr. LI once again takes notice and comes up with a new linear expectation that extends almost straight up into the sky (line 3). Convinced now that he was right about the product in the first place, Mr. LI gets back on board.
Now, just when he thought he had it all figured out, guess what happens to Mr. LI. The latest earnings figures are in line, but the stock sells off sharply. It seems that most investors had come to expect upside earnings. Expectations had passed reality. Now Mr. LI has to adjust his model one more time (line 4). This is probably the first time since the product began to diffuse that his expectations have been anywhere close to reality. Not that it matters. He has already lost money on the stock twice.
Mr. LI’s fate also emphasizes the importance of avoiding sheep-like behavior. He pulls out when growth is slow and few people are paying attention. He jumps back in right when everyone else starts noticing. Recipe for disaster thanks to the curve.
Now let us look at a few recent real world examples: Last July, most Apple investors had come to the conclusion that PowerMac was going to be a flop. Apple just didn't have enough native applications. The new product transition was failing, and Apple's shares approached a 52-week low of around $25. By November, native applications began to appear and PowerMac's were in short supply across the country. Apple stock soared past $40.
In September 1994, Novell was in dire straits. The switching costs to the new version were too high, and no one was adopting the product. Stock price: $15. By February, the stock slipped up past $20. That represents 25% return in just five months. The product diffused after all.
You have probably already guessed our last example. Do you remember the stories in all the trade press last November about how corporations were not adopting Pentium? Intel's stock back then was trading below $60. It's funny how these things play out. Did anyone really think we were never going to switch to Pentium? Today's stock price is above $80.
The trick is to buy the stock when everyone first becomes disappointed and redraws their linear expectation too low. The product is typically waiting on infrastructure; patience is the key. Of course, this works much better for replacement products than for new ones. If you jumped on the Newton story after the first big disappointment, you would still be waiting.
That’s not always true, though. Smartphone penetration followed the same s-adoption curve. Market timing and innovations (for example, making capacitive touchscreens affordable and the widespread adoption of 2.5g wireless) were probably more determinative here.
We recognize that hindsight is always 20-20, and that there are likely doubters in the audience. Therefore, as an experiment, we would like to offer the following prediction. Three months after Windows 95 ships, we suspect the headlines will read "Corporate America Balks at Windows 95," and that shares of Microsoft will slip down on the news. What a great opportunity that will be for nonlinear thinkers like you and me.
This specific prediction did, uh, not pan out. Windows 95 sold a million copies in four days. Only a month after its release, the N.Y. Times tech columnist L.R. Shannon wrote, of himself, “The last sentient being in the universe not to have installed Microsoft Windows 95 finally took the plunge.”
Takeaway
Simple-sounding story here: expect product innovations to diffuse along an s-curve rather than linearly. The not-so simple conclusion: take advantage of the market’s expectation of linearity.
In the age before blitzscaling and hypergrowth were podcast titles, this strikes me as an important admonishment. Even now, it’s easy to overlook the importance of spotting the less-sexy parts of the curve. Everyone loves to brag about exponential growth. Not so much the back-breaking, unscalable customer-by-customer acquisition that must precede that exponential growth. This is where investment opportunity lies.
The next logical question: if the curve looks the same either way, how do you know if the company is at the beginning of an exponential growth curve or if the product is just a flop? Hopefully we get more clarity on his approach to making this judgement in future posts.
Investors much also watch out for the top side of the curve. The significant danger is that of following the herd. It’s easy to assume, given that many investors exist amongst communities of early adopters, that hearing word-of-mouth about a new product or service means that the product is at the beginning of its climb up the exponential growth curve. But what if it’s already reached the top? Maybe that community represents practically the only group capable or interested in purchasing the good. A good reason to get out into the real world more, like Cyan Banister does.
Until tomorrow,
DS


